Commercial Roof Zone Mapping — Minneapolis
A roof zone diagram is the base document for every inspection report, moisture survey, repair record, and capital forecast we produce. Without a consistent zone reference, a roof's condition history is a collection of unlocatable observations — useful to no one five years later.
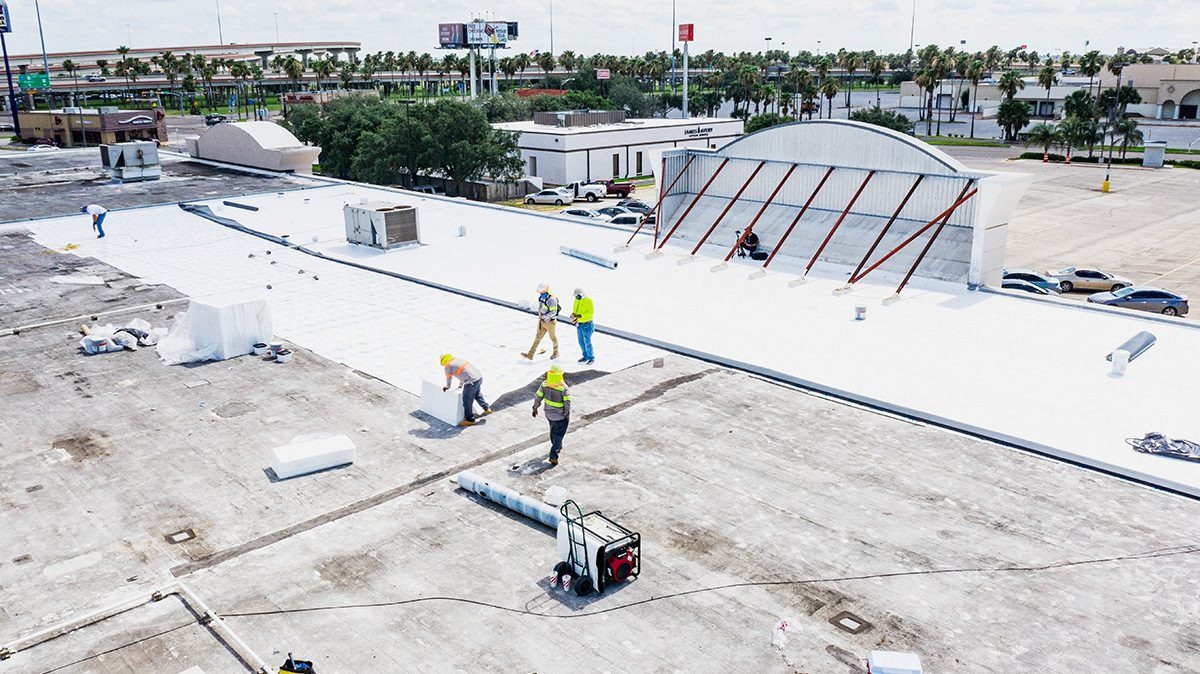
Every commercial flat roof we work on gets a zone diagram — a dimensioned plan view of the roof that establishes labeled zones, marks drain locations, penetrations, mechanical equipment, parapet perimeter, and any significant elevation changes. This diagram is the navigation tool for every subsequent document we produce about that building's roof.
Zone mapping matters because commercial roofs have long service lives and long documentation cycles. A condition report written in 2024 is only useful in 2029 if someone can locate the conditions it documented. A repair record from 2021 that says 'repaired flashing near northwest corner' is not locatable without a zone diagram that defines what 'northwest corner' means on that specific roof. A moisture survey that identified a wet zone 'near drain B' is interpretable five years later only if drain B is consistently labeled in every document produced since.
In the Minneapolis market, where building ownership changes hands through acquisitions, where property management companies turn over, and where the original installing contractor may have exited the market, the zone diagram is often the only consistent reference document in a building's roof history. We establish the zone map at the initial inspection and maintain it through all subsequent documentation for every building in our asset management program.
Roof boundary and dimensions: We field-measure or work from architectural drawings to establish the roof perimeter dimensions with enough accuracy to calculate roof area and locate features by measurement from the parapet edge. For complex roofs with multiple levels — common on the North Loop warehouse conversion inventory and on the mixed-use buildings in the Uptown and Lyn-Lake corridor — each roof level is mapped separately with clear notation of the step elevation between levels.
Zone labels: We divide the roof into labeled zones — typically alphabetical — based on natural divisions in the roof geometry: drain catchment areas, level changes, and distinct roof sections separated by mechanical equipment or structural features. Zone labels are consistent across all subsequent documentation. A zone is never relabeled or redefined without notation in the documentation record.
Drain and scupper locations: Every primary drain, interior drain, scupper, and overflow drain is marked on the zone diagram with a label (D1, D2, etc.) that carries through to all inspection documentation. Drain capacity, type, and condition notes are keyed to these labels in the inspection report.
Penetrations and mechanical equipment: Every HVAC curb, pipe penetration, skylight, hatch, communication equipment mount, solar array attachment point, and parapet opening is marked on the zone diagram with a label. Flashing condition notes in the inspection report are keyed to these labels so that the reader can locate every noted condition on the diagram.
Snow load and drift annotation: For Minneapolis commercial buildings, the zone diagram includes drift accumulation zone annotation — parapet walls where wind direction and building geometry create drift loading above the flat-roof design load, mechanical screen locations where equipment creates drift pockets, and step-down transitions between roof levels where drift forms on the lower roof. This annotation is used in snow load monitoring and winter maintenance planning.
Zone Maps as Long-Term Asset Records
The zone map is a living document — we update it when new penetrations are added, when rooftop equipment is installed or removed, when a repair changes the membrane type in a zone, or when a recover adds a new system over an existing one. For buildings in our asset management program, the current zone map is always attached to the active inspection report so there is never ambiguity about which version of the diagram applies to which report.
When a building changes ownership — a transaction that happens regularly in the Downtown Minneapolis office market, the Eden Prairie corporate campus market, and the Bloomington south suburban corridor — we provide the complete zone-mapped documentation history to the new owner's facilities team. A new owner who inherits a ten-year documented history of zone-mapped inspection reports, repair records, and moisture surveys has a fundamentally different information position than a new owner inheriting an unknown asset.
Zone maps also serve a legal purpose. When a warranty claim is disputed — the manufacturer arguing that a repair was not performed to specification, or an insurer arguing that ice dam damage was a pre-existing condition — the zone map is the reference document that locates the disputed condition in the building's documented history. A zone map that is consistent across ten years of documentation is far more defensible than a collection of undated repair invoices and a contractor's recollection.
Zone maps are delivered as PDF documents sized for standard printing, with a color-coded key for zone labels, drain labels, and penetration labels. For buildings in our asset management program, zone maps are also maintained in our asset management system and can be accessed by the building's facilities team on request. We can produce CAD-compatible formats for building owners who maintain BIM or CAD records for their facilities portfolio.
When we integrate zone maps with infrared scan results or moisture survey data, we produce a composite map that overlays the thermal anomaly or moisture survey result directly on the zone diagram — so the building owner can see the moisture extent relative to the drain locations and parapet boundaries in a single document rather than cross-referencing two separate documents.
Do you produce zone maps for roofs you did not install?
Yes. The zone map is established from field measurement and observation, not from installation records. We can produce a baseline zone map for any commercial flat roof in the Minneapolis metro, regardless of who installed it or how long ago. The initial mapping engagement is included in the baseline inspection when a building joins our asset management program.
What happens to the zone map when a section of the roof is replaced or recovered?
We update the zone map to reflect the new membrane type in the affected zones, the date of the replacement or recover, and any changes in drain or penetration configuration that resulted from the project. The revision history is noted on the map so that the documentation record shows what the zone diagram looked like before and after the project.
Can zone maps be used for snow load monitoring during the winter season?
Yes. The drift annotation on the zone diagram is specifically designed to support winter monitoring — facility staff can use the annotated map to check snow depth at the labeled drift zones and compare against the design load thresholds we document in the asset record. When accumulated snow depth at a drift zone approaches the threshold that warrants professional assessment, the monitoring protocol references the zone label and the specific measurement location from the diagram.
Get a zone map established for your Minneapolis commercial roof.
We will field-measure the roof, establish the zone diagram with drain, penetration, and drift annotation, and deliver a PDF document that becomes the reference base for all subsequent inspection and capital planning documentation.
- Roof Asset Management
- Condition Reporting
- Competitive Bid Coordination
- Procurement Support
- Life Cycle Cost Analysis
- Capital Planning Support
- Government Building Roofing
- Modified Bitumen Roofing